In today’s blog posting I want to talk about a very common problem within SQL Server: handling statistics with ascending key columns. As you already know, every statistics object in SQL Server has an associated Histogram. The histogram describes the data distribution for a specific column with multiple steps. SQL Server supports up to 200 steps in one histogram, but there is a problem, when you query for a range of data that comes after the last step in the histogram. Let’s have a look at the following code that generates such a scenario.
-- Create a simple orders table
CREATE TABLE Orders
(
	OrderDate DATE NOT NULL,
	Col2 INT NOT NULL,
	Col3 INT NOT NULL
)
GO

-- Create a Non-Unique Clustered Index on the table
CREATE CLUSTERED INDEX idx_CI ON Orders(OrderDate)
GO

-- Insert 31465 rows from the AdventureWorks2012 database
INSERT INTO Orders (OrderDate, Col2, Col3) SELECT OrderDate, CustomerID, TerritoryID FROM AdventureWorks2012.Sales.SalesOrderHeader
GO

-- Rebuild the Clustered Index, so that we get fresh statistics.
-- The last value in the Histogram is 2008-07-31.
ALTER INDEX idx_CI ON Orders REBUILD
GO

-- Insert 200 additional rows *after* the last step in the Histogram
INSERT INTO Orders (OrderDate, Col2, Col3)
VALUES ('20100101', 1, 1)
GO 200
After the Index Rebuild, when you look at the histogram, you can see that the value of the last step is 2008-07-31.

But as you have seen, we have inserted 200 additional rows after the last step into the table. In that case the histogram doesn’t reflect the actual data distribution anymore, but SQL Server still has to perform the cardinality estimation. Let’s have a look now at how this situation is handled in the various versions of SQL Server.
SQL Server 2005 SP1 – SQL Server 2012
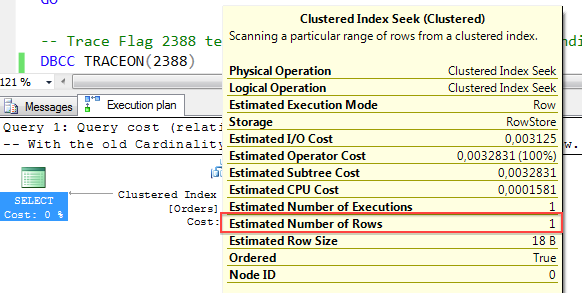
Prior to SQL Server 2014 the cardinality estimation for that specific scenario was very simple: SQL Server estimates just 1 row, as you can see in the following picture.

Since SQL Server 2005 SP1, the Query Optimizer is able to mark a column as Ascending to overcome the previously described limitation. SQL Server marks a column as ascending, if you have updated the statistics object 3 times with ascending column values. To see if a column was marked ascending, you can use the trace flag 2388. When you enable that trace flag, the output of the DBCC SHOW_STATISTICS changes, and additional columns are returned.
![]()
The following code now updates the statistics 3 times, and every time inserts rows at the end of our clustered index with ascending key column values.
-- => 1st update the Statistics on the table with a FULLSCAN
UPDATE STATISTICS Orders WITH FULLSCAN
GO

-- Insert 200 additional rows *after* the last step in the Histogram
INSERT INTO Orders (OrderDate, Col2, Col3)
VALUES ('20100201', 1, 1)
GO 200

-- => 2nd update the Statistics on the table with a FULLSCAN
UPDATE STATISTICS Orders WITH FULLSCAN
GO

-- Insert 200 additional rows *after* the last step in the Histogram
INSERT INTO Orders (OrderDate, Col2, Col3)
VALUES ('20100301', 1, 1)
GO 200

-- => 3rd update the Statistics on the table with a FULLSCAN
UPDATE STATISTICS Orders WITH FULLSCAN
GO
Afterwards, when you run the DBCC SHOW_STATISTICS command, you can see that SQL Server has now marked the column as Ascending.

When you now query again for rows, which are not part of the histogram, nothing actually changes. To make use of the ascending marked key column, you have to enable another trace flag – 2389 in our case. If you enable this trace flag, then the Query Optimizer uses the Density Vector to perform the cardinality estimation.
-- Now we query the newly inserted range which is currently not present in the Histogram.
-- With Trace Flag 2389, the Query Optimizer uses the Density Vector to make the Cardinality Estimation.
SELECT * FROM Orders
WHERE OrderDate = '20100401'
OPTION (RECOMPILE, QUERYTRACEON 2389)
GO
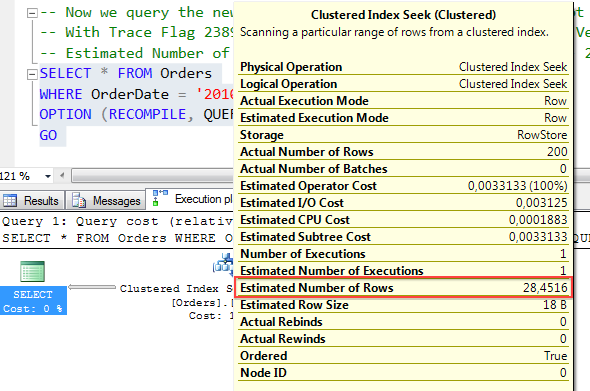
Our table has currently a density of 0.0008873115, therefore the Query Optimizer estimates 28.4516 rows: 0.0008873115 * (32265 – 200).

That estimate still isn’t the best one, but is still better than the initial estimate of just 1 row.
SQL Server 2014
One of the big new features in SQL Server 2014 is the introduction of a new Cardinality Estimator. The new cardinality estimator deals with the Ascending Key Problem very simply: it will use by default without any trace flags the density vector of the statistics object to perform the cardinality estimation. The following query enables the new cardinality estimator with the trace flag 2312 and runs the same query as previously.
-- With the new Cardinality Estimator SQL Server estimates 28.4516 rows at the Clustered Index Seek operator.
SELECT * FROM Orders
WHERE OrderDate = '20100401'
OPTION (RECOMPILE, QUERYTRACEON 2312)
GO
When you look at the cardinality estimate, you can see that the Query Optimizer again estimates 28.4516 rows, but this time there is no need for the column to be marked as ascending. This is just the new default behavior.
Summary
In this blog posting I have shown you how the Query Optimizer of SQL Server deals with the Ascending Key Problem. Prior to SQL Server 2014 you needed trace flag 2389 to get a better cardinality estimate – as long as the column is marked as ascending. With SQL Server 2014, the Query Optimizer uses by default the density vector to perform the cardinality estimation, which makes things just more easier. I hope you have enjoyed this blog posting, and that you have some better ideas on how to deal with ascending key columns in SQL Server.
Thanks for reading!
-Klaus