Today I want to talk about a specified wait type that can be sometimes very hard to troubleshoot: the THREADPOOL wait type. This wait type is specific to the internal thread scheduling mechanism inside SQL Server.
As you might know SQL Server internally uses its own “operating system” to implement thread scheduling and memory management – the SQLOS. The SQLOS provides a set of worker threads that are used to execute queries that are submitted to SQL Server. The problem is that those worker threads can be exhausted sometimes – maybe because of a Locking/Blocking scenario. In this case SQL Server isn’t able to execute any more requests inside the engine, because no free worker threads are available any more.
You can configure through the max worker threads option (through sp_configure) how many worker threads are available to SQLOS. By default the value of this option is 0, which means SQL Server itself decides how many worker threads are used. The number of the available worker threads depends on the processor architecture (x32, x64) and the number of CPUs that you have available. Books Online (see http://msdn.microsoft.com/en-us/library/ms187024.aspx) has the following table that describes the various possible combinations:
|
Number of CPUs |
x32 |
x64 |
|
<= 4 Processors |
256 |
512 |
|
8 Processors |
288 |
576 |
|
16 Processors |
352 |
704 |
|
32 Processors |
480 |
960 |
You can also check through the column max_workers_count in sys.dm_os_sys_info how many worker threads your SQL Server instance is using. With the following example I want to demonstrate now how you can get thread starvation in SQL Server and how you can resolve it.
CAUTION: DON’T DO THE FOLLOWING STEPS ON A PRODUCTION SYSTEM!!!
In the first step we create a new database and a simple table for our sample scenario. I want to be unique as possible; therefore I use unique table and column names 😉
USE master
GO

CREATE DATABASE ThreadPoolWaits
GO

USE ThreadPoolWaits
GO

–- Create a new test table (this one will be unique on earth – hopefully…)
CREATE TABLE [SomeCrazyUniqueTableName_6EFF088F-443B-4EBC-A4C7-9FC146D2EE49]
(
	[MyUniqueColumnName1_F67DAC4A-C202-49BB-829A-071130BF1160] INT IDENTITY(1, 1) NOT NULL PRIMARY KEY,
	[MyUniqueColumnName2_438B7184-B476-48A4-B5FA-DC34B99FA0A4] INT
)
GO

– Insert a record
INSERT INTO [SomeCrazyUniqueTableName_6EFF088F-443B-4EBC-A4C7-9FC146D2EE49]
VALUES (1)
GO
As you can see from the previous listing, our table definition is very simple. In the next step I’m creating a new stored procedure that encapsulates some read workload inside that database.
–- Create a stored procedure that encapsulates a read workload
CREATE
PROCEDURE MyCustomUniqueStoredProcedureName_ReadWorkload
AS
BEGIN
	SELECT * FROM [SomeCrazyUniqueTableName_6EFF088F-443B-4EBC-A4C7-9FC146D2EE49]
END
GO
Finally we are beginning a new transaction, making an update to the previous created table, and never committing that transaction:
–- Begin a transaction that never commits…
BEGIN TRANSACTION
	UPDATE [SomeCrazyUniqueTableName_6EFF088F-443B-4EBC-A4C7-9FC146D2EE49] WITH (TABLOCKX)
		SET [MyUniqueColumnName2_438B7184-B476-48A4-B5FA-DC34B99FA0A4] = 2
GO
By now you have a pending transaction inside your SQL Server instance that holds an exclusive table lock because of the TABLOCKX query hint. When you now execute the previous created stored procedure from a different session, the stored procedure is waiting because it needs to acquire a Shared lock for reading the record:
EXEC MyCustomUniqueStoredProcedureName_ReadWorkload
GO
You can also check this Locking/Blocking scenario through the DMV sys.dm_db_tran_locks, which will show you a waiting request:
SELECT
	resource_associated_entity_id,
	request_mode,
	request_status,
	request_session_id
FROM sys.dm_tran_locks
WHERE resource_database_id = DB_ID(‘ThreadPoolWaits’) AND resource_type = ‘OBJECT’
GO
In this simple scenario with just one waiting query inside SQL Server, nothing special occurs. But how will SQL Server react when you use a massive amount of queries that is larger than the possible max worker threads? Let’s try it. I’m using for this task the ostress.exe utility that is part of the RML Tools that are provided free by Microsoft (see here). In my configuration (x64, 8 CPUs) SQL Server uses internally 576 worker threads. So I’m simulating with ostress.exe 600 concurrent connections to SQL Server through the following command line:
ostress.exe
-Q”EXEC ThreadPoolWaits.dbo.MyCustomUniqueStoredProcedureName_ReadWorkload”
-n600
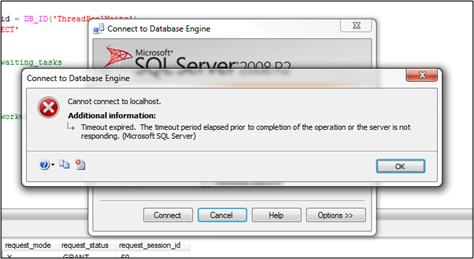
When you execute that command prompt, it takes a few seconds until ostress.exe has created the 600 worker threads, and nothing special happens. Seems so far so good. Let’s now analyze the situation and create a new connection through SQL Server Management Studio to your SQL Server instance. Oops, the connection can’t be made:

SQL Server isn’t responding anymore!!! This makes sense, because we have now exhausted the maximum available worker threads. Almost all submitted requests to SQL Server are currently waiting for a Shared Lock (LCK_M_S wait type), and all the other ones can’t be enqueued inside SQL Server because no worker threads are available anymore (THREADPOOL wait type). But how can we troubleshoot that scenario now? Restarting SQL Server isn’t always really an option…
Fortunately Microsoft provides since SQL Server 2005 the so-called Dedicated Admin Connection (DAC). With this connection you are able to log into SQL Server even when you have worker thread starvation or high memory pressure, because the DAC has its own
- Scheduler
- Memory Node
- TCP Port
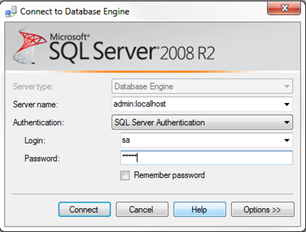
inside SQLOS. Therefore SQL Server is able to accept and serve the DAC connection – even in high sophisticated troubleshooting scenarios like this one. But there is only one available DAC for the whole SQL Server instance, which must be also taken into account! When you want to connect through the DAC, you have to use the following syntax: admin:<servername> where <servername> is the name of your SQL Server instance. So let’s start up a new instance of SQL Server Management Studio and log into SQL Server through the DAC. Please be aware that you don’t connect the Object Explorer through the DAC, because the DAC isn’t supported for the Object Explorer. You can only use a simple query window that connects through the DAC:

When you have successfully connected through the DAC, you are now able to run your diagnostic queries. You must be also aware that the DAC doesn’t support Auto Completion, because Auto Completion uses its own connection in the background – so you have to know the DMVs you want to use for troubleshooting J. In the first step we can check sys.dm_exec_requests which requests are currently waiting inside SQL Server:
SELECT
	r.command,
	r.sql_handle,
	r.plan_handle,
	r.wait_type,
	r.wait_resource,
	r.wait_time,
	r.session_id,
	r.blocking_session_id
FROM sys.dm_exec_requests r INNER JOIN sys.dm_exec_sessions s ON r.session_id = s.session_id
WHERE s.is_user_process = 1
GO
In my configuration this query returns me 547 rows, which means 547 user requests (WHERE s.is_user_process = 1) are currently waiting inside SQL Server. But we have started our stored procedure with 600 concurrent users… sys.dm_exec_requests shows you only those requests that have an underlying worker thread inside SQL Server, because those requests are currently executing inside SQL Server. But where are the others? Those other pending requests are only accessible through sys.dm_os_waiting_tasks – they have a wait type of THREADPOOL:
SELECT * FROM sys.dm_os_waiting_tasks
WHERE wait_type = ‘THREADPOOL’
GO
They are just waiting until a new thread from the worker pool gets free. But in our scenario every thread is currently suspended and bound to a user request, therefore those requests will wait forever! You can also see the THREADPOOL wait type only inside sys.dm_os_waiting_tasks and never in sys.dm_exec_requests, because a request in sys.dm_exec_requests is already bound to a worker thread inside SQL Server. When you look back to the output of sys.dm_exec_requests you can also see the columns session_id and blocking_session_id at the end of the result set. Those 2 columns are showing you the blocking chain inside SQL Server:

As you can see almost every session has a blocking_session_id of 56, and the session_id 56 has a blocking_session_id of 52. The session_id 52 is our head blocker! Let’s further analyze the session of the head blocker:
-– Analyze the head blocker session
SELECT
	login_time,
	[host_name],
	[program_name],
	login_name
FROM sys.dm_exec_sessions
WHERE session_id = 52
GO

–- Analyze the head blocker connection
SELECT
	connect_time,
	client_tcp_port,
	most_recent_sql_handle
FROM sys.dm_exec_connections
WHERE session_id = 52
GO
The most interesting column is here most_recent_sql_handle from sys.dm_exec_connections which we can use to retrieve the executed SQL statement. When you use the DMF sys.dm_exec_sql_text and pass in the value of the most_recent_sql_handle column you are able to retrieve the executed SQL statement:
SELECT FROM sys.dm_exec_sql_text(0x01001A0015BE5D3170CC4483000000000000000000000000
GO
This SELECT statement will return you the following string:
— Begin a transaction that never commits… BEGIN TRANSACTION UPDATE [SomeCrazyUniqueTableName_6EFF088F-443B-4EBC-A4C7-9FC146D2EE49] WITH (TABLOCKX) SET
[MyUniqueColumnName2_438B7184-B476-48A4-B5FA-DC34B99FA0A4] = 2
This is our initial query where we left our transaction open. By now we have tracked down the problematic query that had leaded to THREADPOOL and LCK_M_S waits, and finally we can kill that session through the DAC:
KILL 52
GO
Now it takes several seconds until the session is killed, and finally our blocking scenario is gone. By now your SQL Server is again able to accept new connections and will work in the usual way. When you are done with troubleshooting through the DAC connection, don’t forget to close that special connection, because there is only one DAC available for the whole SQL Server instance! When you afterwards look into the SQL Server Error Log, you will also see a message like the following one:
New queries assigned to process on Node 0 have not been picked up by a worker thread in the last 1680 seconds. Blocking or long-running queries can contribute to this condition, and may degrade client response time. Use the “max worker threads” configuration option to increase number of allowable threads, or optimize current running queries. SQL Process Utilization: 0%. System Idle: 96%.
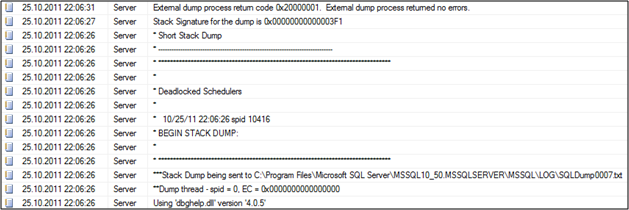
This is also an indication that you had worker thread starvation inside your SQL Server instance. As a side-effect this scenario has also leaded to so-called Deadlocked Schedulers, which Amit Banerjee describes in more detail here. When SQL Server encounters Deadlocked Schedulers, SQL Server will write out a Stack Dump to your SQL Server LOG directory. You can also see a Deadlocked Scheduler inside the SQL Server Error Log:

Sometimes I see customers which just blindly reconfigure the max worker threads setting inside SQL Server, because they think they need more worker threads for their workload. But as with almost every problem in SQL Server, there is some root cause which has leaded to the problem that you are currently seeing. In our scenario the root cause was an uncommitted transaction, which leaded to a blocking scenario, which leaded to thread starvation, which finally leaded to an unresponsive SQL Server. As you can see from this explanation, there could be a very long chain until you find your root cause – so keep that in mind for your next troubleshooting scenarios.
To make it easy for you to reproduce that special scenario, you can download the needed scripts from here.
Thanks for reading!
-Klaus
5 thoughts on “Troubleshooting THREADPOOL Waits”
That was fun! Great information thanks.
Repeated the same thing though my env is a little diff, its a VM under Win 6.1 (sp1). VM Config — Win 5.2 – 32 bit // SQL Server 2005 SP4
Fixed MAX worker threads @ 128, SQL starts with 18 threads stabilizes at 38-36.
New batches added – max thread count reached 142 at times 144.
dbcc sqlperf (umsstats) -> (after & before)
num of tasks 131 13
avg scheduler load 245 17
num workes 128 128
active workers 125 10
work queued 3 0
After throwing -n420 with OStress my output looks differnt.
On running — sys.dm_os_waiting_tasks WHERE wait_type =’THREADPOOL’
my list has 35420 rows, blocking session IDs are repeated and sessison ID is listed as NULL !!
Any reason for this ?
Great Information!!!
good information 🙂
Good stuff Klaus. Thanks for the info/analysis.
Comments are closed.