Designing and debugging your own operating system is one of the most fulfilling but technically demanding projects you can undertake as a systems programmer. You have to build every abstraction yourself – memory management, privilege levels, system calls, user-space transitions, and interrupt handling – all while dealing with the quirks of real hardware and complex toolchains. What makes this exponentially harder is debugging. There’s no OS beneath you to help; you are the OS. For a long time, my only tools were VGA text output and manually decoding register dumps. But once I integrated QEMU, GDB, and Visual Studio Code, the game changed.
This post walks through how I built a fully integrated, source-level debugging environment inside Visual Studio Code. The environment lets me load multiple ELF binaries (kernel and user programs), inspect paging structures, set breakpoints, view live memory and disassembly, and – most importantly – seamlessly step between Ring 3 and Ring 0 code. All without leaving my editor.
Boot Setup and Binary Artifacts
My operating system boots from a FAT12 image (kaos64.img) containing a real boot sector, multi-stage loaders, and several payloads: a 64-bit kernel, multiple user-mode binaries, and supporting resources. The image is built using a custom tool called fat_imgen, and the kernel is loaded to a higher-half virtual address space (0xFFFF800000100000). Each user-space ELF binary is loaded at a canonical low address (0x400000) with appropriate 64-bit paging and privilege separation.
I compile both kernel.elf and shell.elf using a cross-compiler targeting x86_64-elf. Each ELF file contains complete DWARF debug information (-g -O0), while the raw *.bin counterparts are used for runtime bootstrapping and file system placement. This separation is crucial: the ELF files are used exclusively for debugging; the .bin files are used for execution.
Launching QEMU with GDB Debugging
To support remote debugging, QEMU is launched with:
qemu-system-x86_64 -drive format=raw,file=${workspaceFolder}/main64/kaos64.img -s -SThis causes QEMU to listen on TCP port 1234 and pause execution at the first instruction. Visual Studio Code will then attach via GDB and take full control over the VM. At this point, you have a paused CPU, and GDB has the ability to control memory, registers, breakpoints, and execution flow. The only missing piece is tying this together with VS Code’s debugging infrastructure.
Setting Up launch.json for Kernel and User ELF Debugging
VS Code uses launch.json to configure debugging sessions. The default program field is limited to one binary, but that’s not sufficient when you’re working with both kernel and user binaries, each loaded at different virtual addresses. The solution lies in the “setupCommands” array, which injects GDB commands into the remote session after connection. Here’s the launch.json file I use to debug my kernel and user mode programs simultaneously:
{
  "version": "0.2.0",
  "configurations": [
    {
      "name": "Debug KAOS x64 via QEMU GDB Stub",
      "type": "cppdbg",
      "request": "launch",
      "program": "${workspaceFolder}/main64/kernel/kernel.elf",
      "cwd": "${workspaceFolder}",
      "MIMode": "gdb",
      "miDebuggerPath": "x86_64-elf-gdb",
      "miDebuggerServerAddress": "localhost:1234",
      "preLaunchTask": "Build KAOS",
      "stopAtEntry": true,
      "externalConsole": false,
      "setupCommands": [
        {
          "description": "Substitute source code path",
          "text": "-interpreter-exec console \"set substitute-path /src/main64 ${workspaceFolder}/main64\""
        },
        {
          "description": "Set disassembly flavor to Intel",
          "text": "-interpreter-exec console \"set disassembly-flavor intel\""
        },
        {
          "description": "Load kernel symbols at virtual address",
          "text": "-interpreter-exec console \"add-symbol-file ${workspaceFolder}/main64/kernel/kernel.elf 0xFFFF800000100000\""
        },
        {
          "description": "Load user program symbols at virtual address",
          "text": "-interpreter-exec console \"add-symbol-file ${workspaceFolder}/main64/programs/shell/shell.elf 0x0000700000000000\""
        }
      ]
    }
  ]
}
This configuration:
- Connects to QEMU’s GDB stub over TCP
- Loads kernel and user symbols at their exact virtual memory locations
- Enables real-time disassembly view
- Automatically pauses at the entry point so I can set initial breakpoints
What makes this powerful is that VS Code can now understand your memory map. You can set breakpoints in both kernel and user programs and even follow execution across privilege level boundaries like syscalls or exceptions.
Stepping from User Mode to Kernel Mode
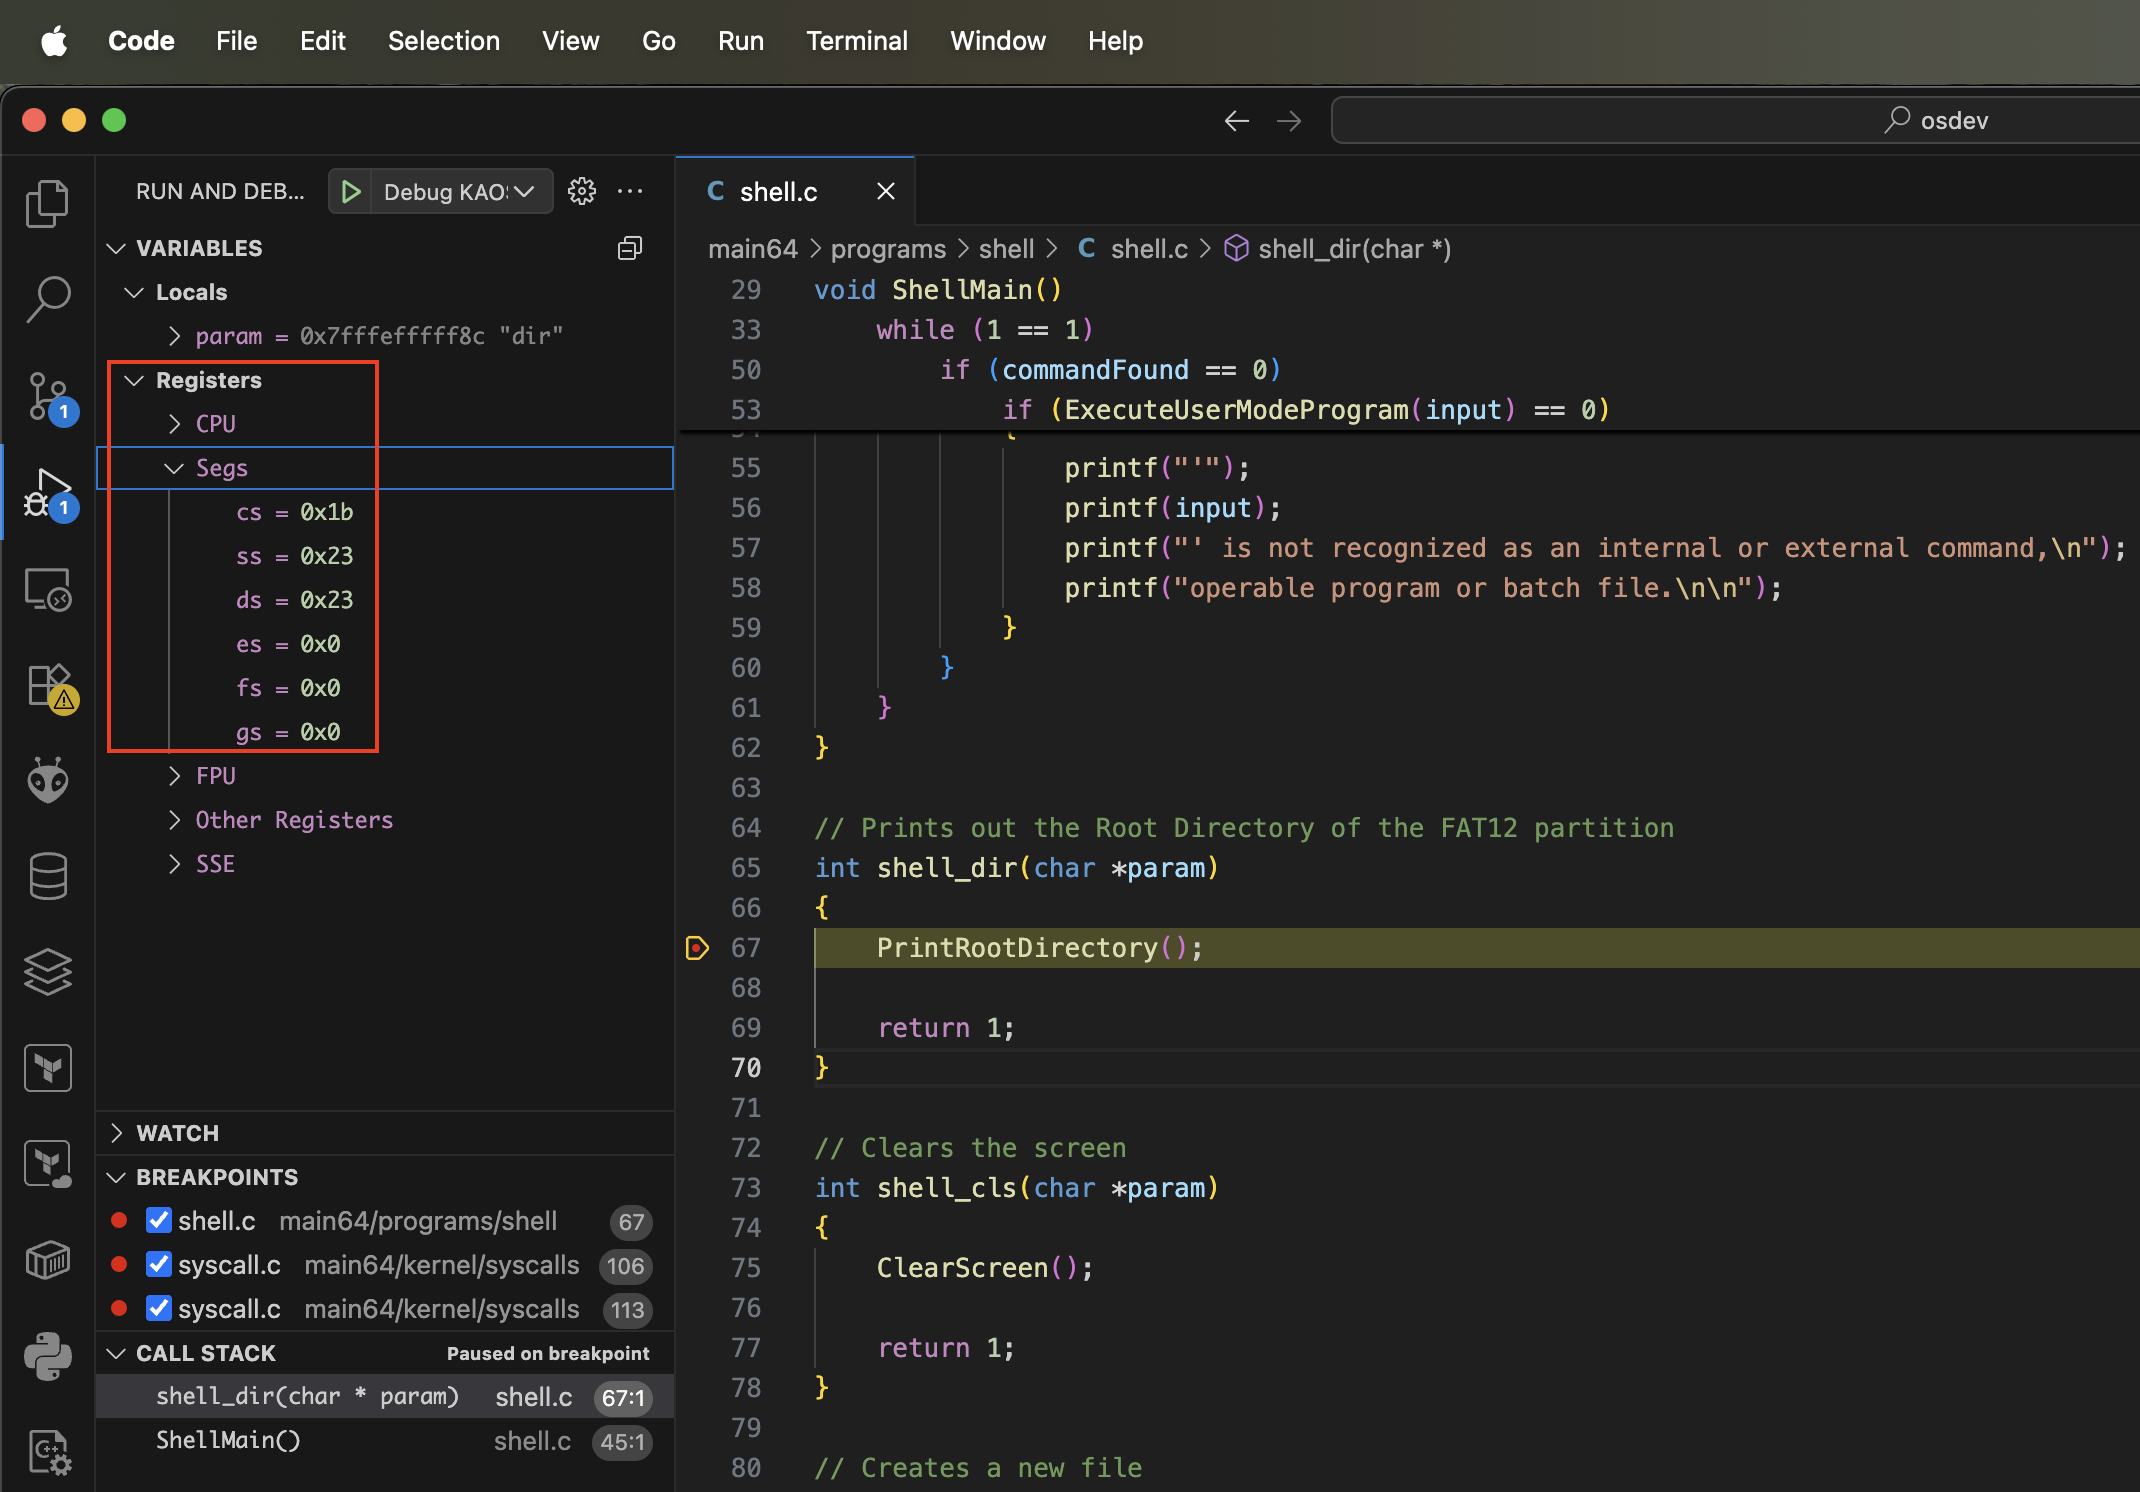
One of the most powerful capabilities this gives you is seamless stepping between Ring 3 and Ring 0. My user programs run with DPL=3, and my kernel uses the SYSCALL instruction to enter kernel space. In GDB, I can step through a user-mode program, hit a syscall, and watch as execution jumps into the kernel handler. Because I’ve loaded symbols for both privilege levels, the debugger always knows where it is. To confirm the current privilege level, you can just look at the segment registers (register cs in this case) in Visual Studio Code:
Memory Inspection in VS Code
This is where things get tricky. While VS Code offers a memory viewer, it often fails to show contents when connected to a remote target like QEMU. This is due to how some debugger extensions (especially cppdbg) handle memory reads in MI mode. Fortunately, you can fall back to the GDB console inside VS Code and use commands like:
-exec x/32x $rsp            # Inspect stack
-exec x/16i $rip            # Disassemble current function
-exec x/64xb 0xB8000        # Inspect VGA text buffer
-exec x/16x 0xFFFF8000001AB000  # View kernel paging structure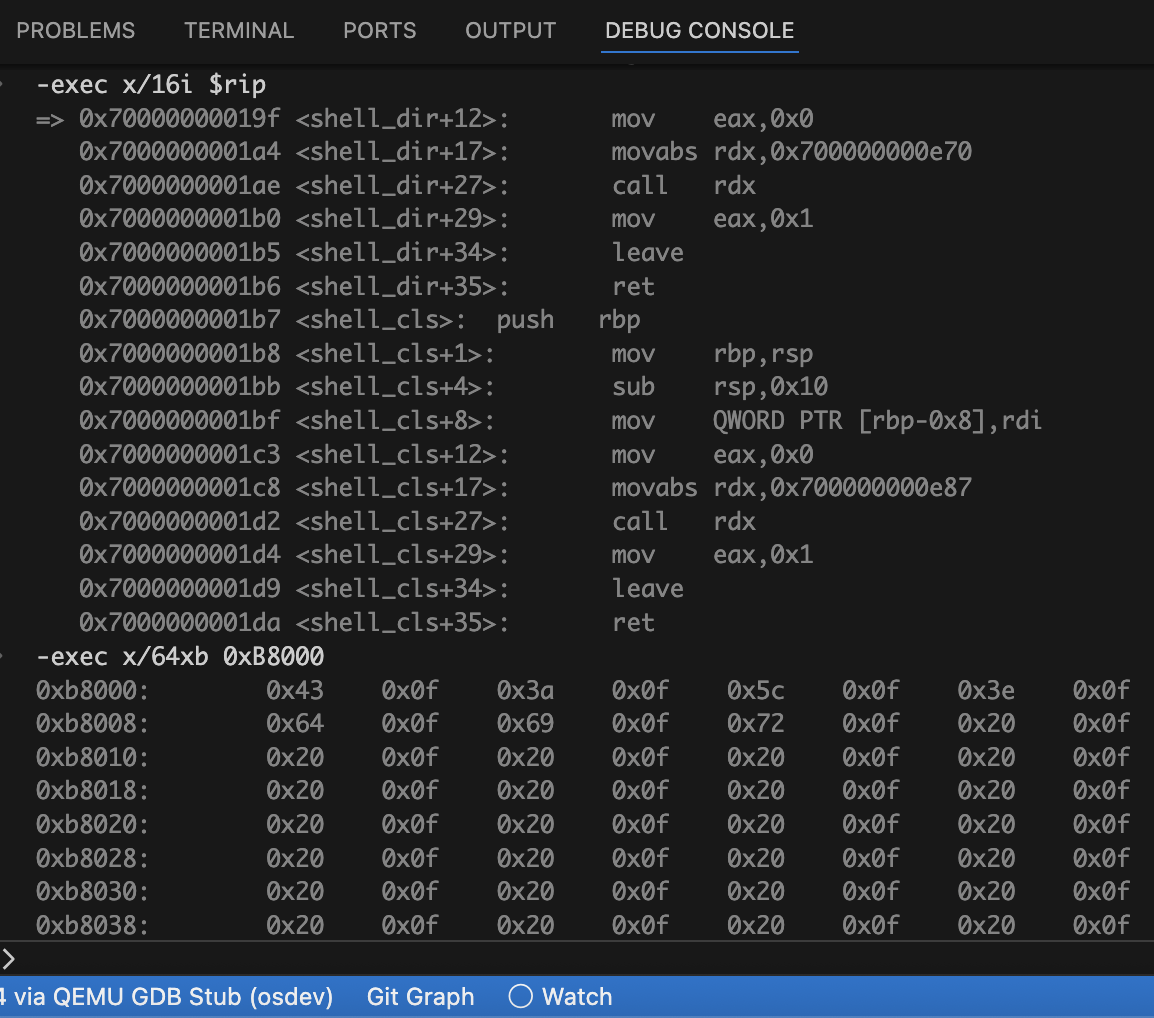
You can also set breakpoints inside interrupt service routines, exception handlers, and syscalls. This makes it easy to debug traps, verify correct context switching, and inspect the page tables being traversed during virtual address translation.
Symbol Visibility and Debug Accuracy
Everything in this setup hinges on correct symbol visibility. If your link.ld file mismatches the actual load address of your kernel or user binary, GDB will load symbols but associate them with the wrong addresses, rendering source-level stepping useless. Always match your add-symbol-file address with the virtual address of the .text section as defined in your linker script.
Additionally, compile all code with:
- -g to emit debug symbols
- -O0 to disable optimizations that could reorder or inline code
- -fno-omit-frame-pointer to preserve stack traces
For assembly routines (e.g. ISRs, syscalls), ensure that NASM is invoked with -g -F dwarf so that the symbols are visible in GDB as well.
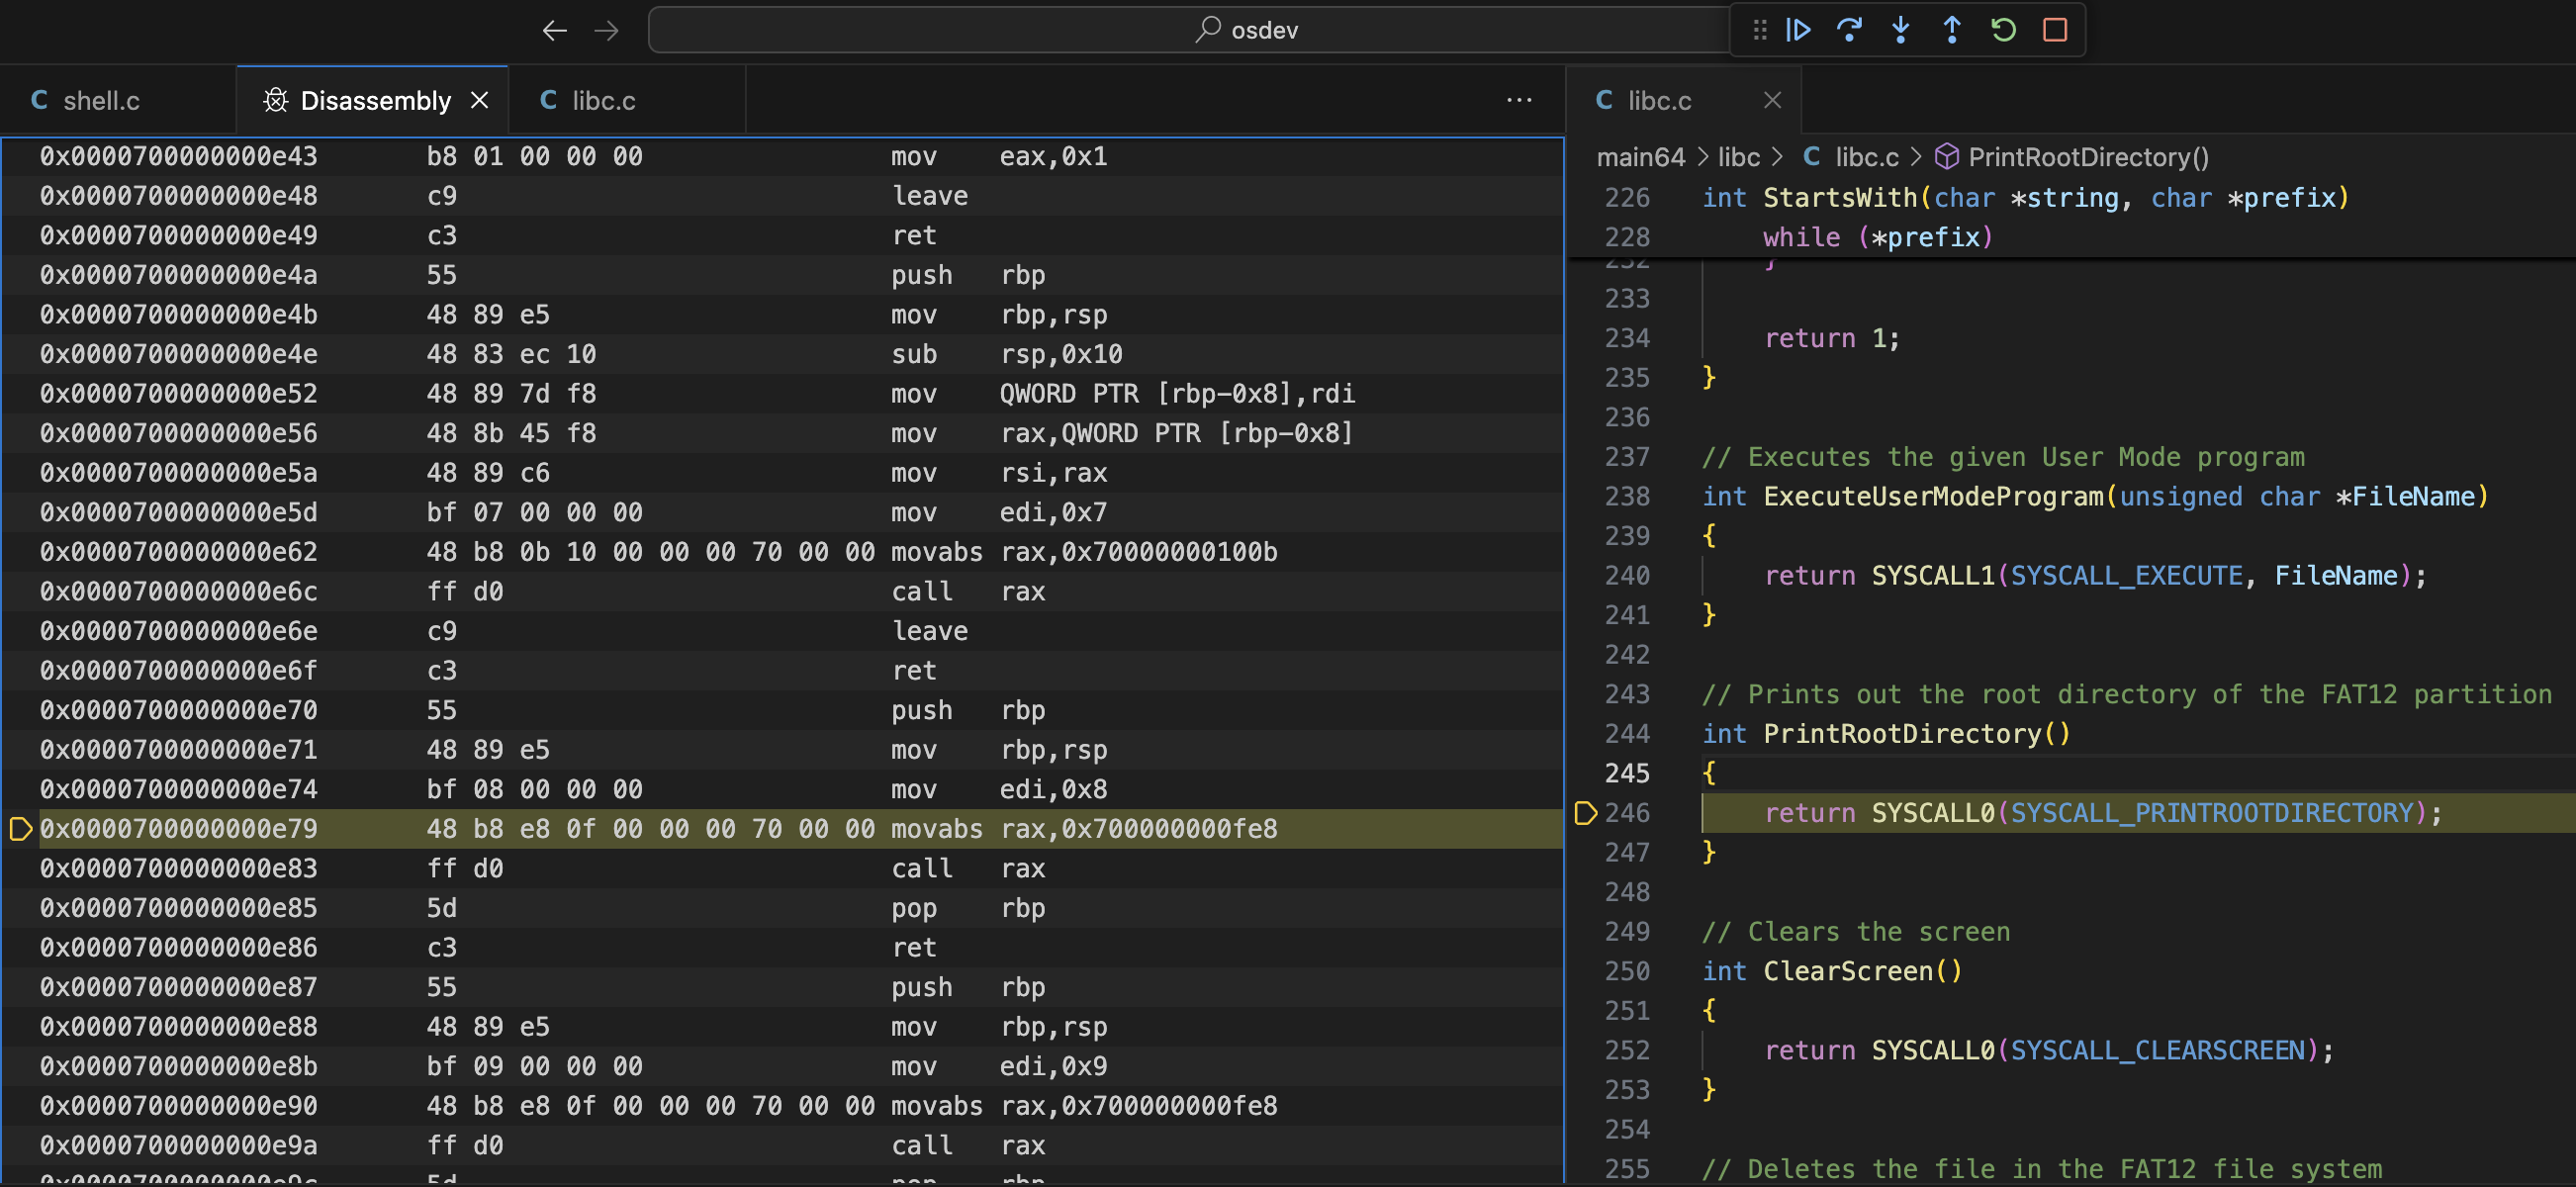
What About Visual Disassembly?
The Disassembly pane in VS Code works well when the instruction pointer is inside a known symbol.
Breakpoints and Stack Tracing
Once symbols are loaded, setting breakpoints is as simple as clicking the gutter in VS Code. These work in both kernel and user code. You can also set line-specific breakpoints or symbolic breakpoints like:
-exec break syscall_handler
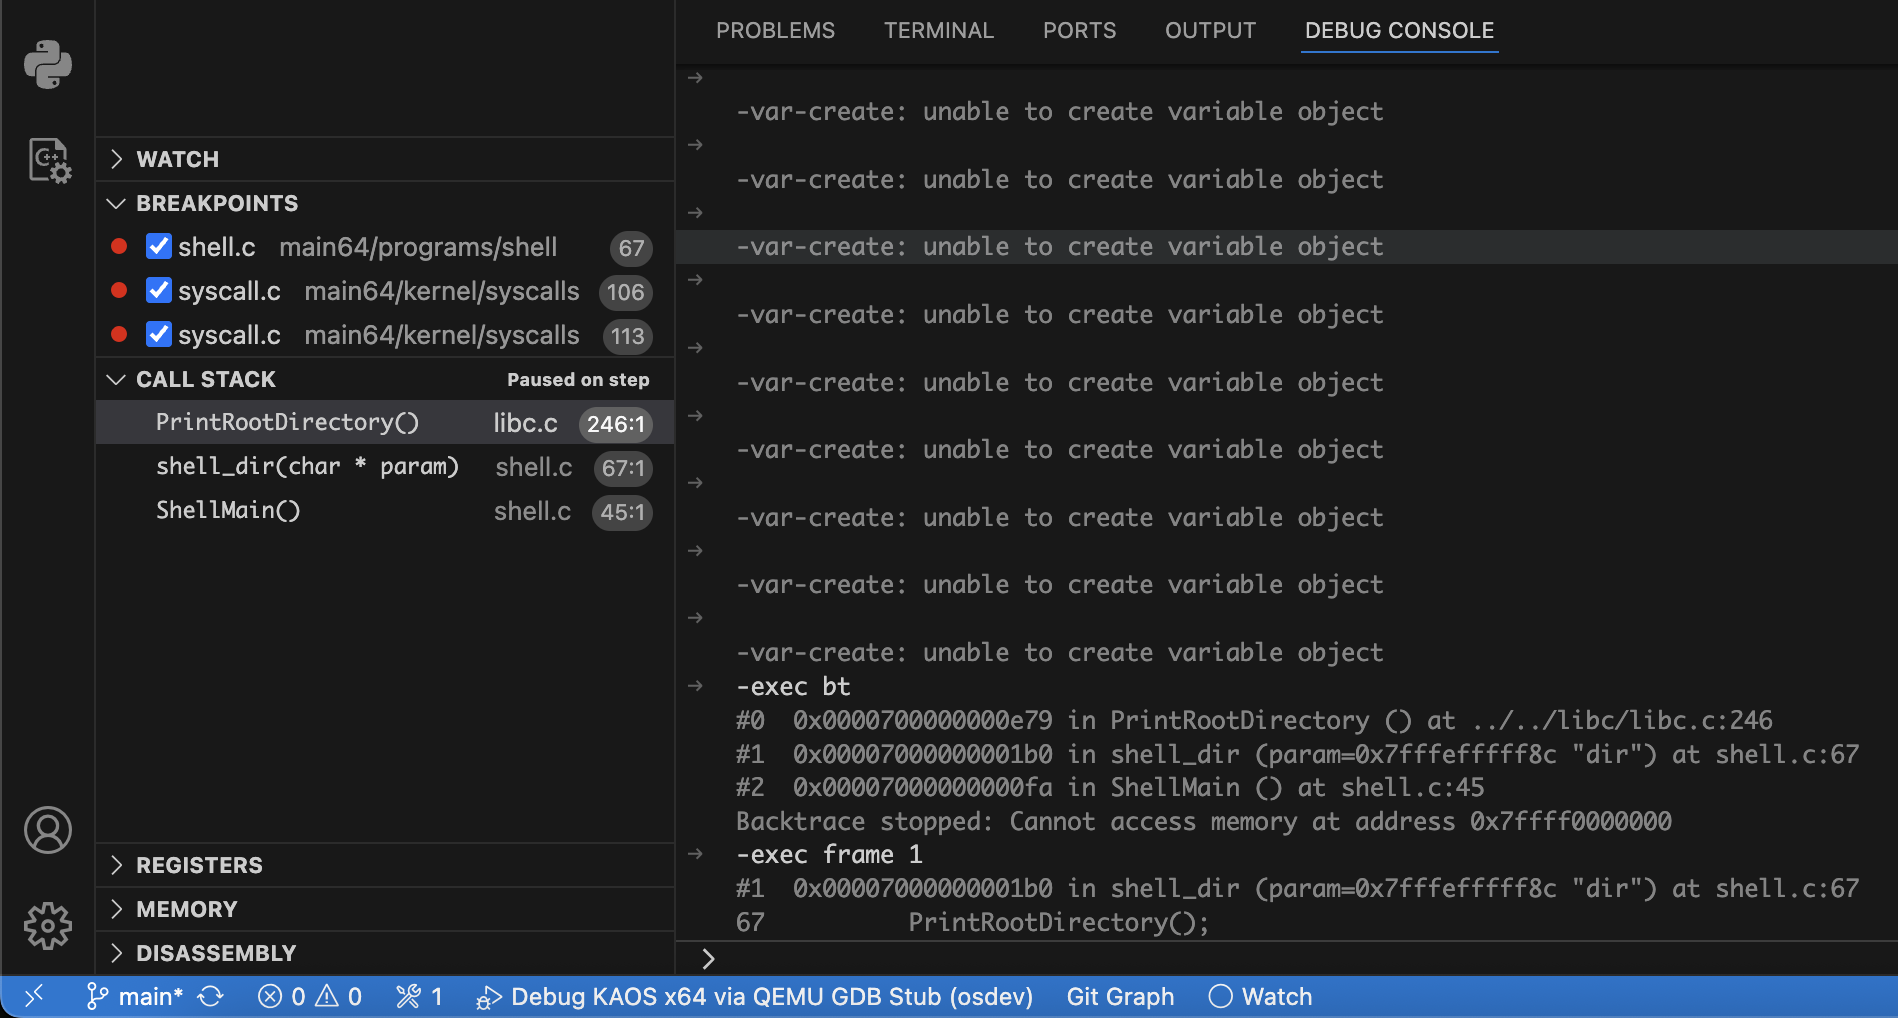
-exec break shell.c:42To inspect the current call stack, just open the “Call Stack” pane in VS Code, or run:
-exec bt
-exec frame 1
You can switch between stack frames, view local variables, and even inspect function arguments passed via registers (e.g., $rdi, $rsi, etc.), especially useful for SYSCALL introspection.
Summary
This setup fundamentally changes how I work on my operating system. Instead of dead ends, I now get visibility into every trap, every syscall, and every address translation failure. I can follow execution from user programs through the syscall instruction, into the kernel handler, and back again. I can inspect my own ELF loader, watch page tables being walked, and validate interrupt handling logic in real time.
What’s most remarkable is that this is all possible with free tools: QEMU, GDB, and VS Code. Just some careful configuration, symbol discipline, and a modern development environment. If you’re building your own operating system, I highly recommend investing the time to set up this kind of debugging workflow. The insight it gives you isn’t just helpful – it’s essential. It’s what takes your OS project from guesswork to engineering. You can find the whole source code of my x64 OS here.
Thanks for your time,
-Klaus