I’m a SQL Server performance troubleshooter. I make a living out of SQL Server problems. Sounds crazy, but a lot of people approach me every month with various performance related problems that they can’t explain, but which they have to resolve.
And a lot of time I hear from them that yesterday the performance of SQL Server was great and within the normal range, but today everything has changed and SQL Server is doing horrible, crazy things that can’t be explained. In that case I step in, analyze the whole SQL Server installation, and finally find the root cause of the performance problem with some magical investigation methods.
But very often the root cause is the same: a so-called Plan Regression, where the execution plan of a specific query has changed. Yesterday SQL Server cached a „good“ plan in the plan cache, and today a „terrible“ plan was generated, cached, and finally reused – over and over again.
With SQL Server 2016 it seems that I’m becoming redundant, because Microsoft has introduced the Query Store. It is one of the hottest features of this release! The Query Store helps you to easily find whether a plan regression is causing you performance problems. And if you find a plan regression, it is also very easy to transparently force a specific plan without using any Plan Guides. Sounds interesting to you? OK let’s walk through a specific scenario and I’ll show you how to use the Query Store to find and finally fix a plan regression in SQL Server 2016.
The Query Store – my competitor
Before you can use the Query Store feature in SQL Server 2016, you have to enable it for a specific database. This is done through an ALTER DATABASE statement, as you can see in the following listing.
CREATE DATABASE QueryStoreDemo
GO

USE QueryStoreDemo
GO

-- Enable the Query Store for our database
ALTER DATABASE QueryStoreDemo
SET QUERY_STORE = ON
GO

-- Configure the Query Store
ALTER DATABASE QueryStoreDemo SET QUERY_STORE
(
	OPERATION_MODE = READ_WRITE,
	CLEANUP_POLICY = (STALE_QUERY_THRESHOLD_DAYS = 367),
	DATA_FLUSH_INTERVAL_SECONDS = 900,
	INTERVAL_LENGTH_MINUTES = 1,
	MAX_STORAGE_SIZE_MB = 100,
	QUERY_CAPTURE_MODE = ALL,
	SIZE_BASED_CLEANUP_MODE = OFF
)
GO
Books Online also describes the various options for you in more detail. In the next step I create a very simple table, create a Non-Clustered index, and finally insert 80000 records into it.
-- Create a new table
CREATE TABLE Customers
(
	CustomerID INT NOT NULL PRIMARY KEY CLUSTERED,
	CustomerName CHAR(10) NOT NULL,
	CustomerAddress CHAR(10) NOT NULL,
	Comments CHAR(5) NOT NULL,
	Value INT NOT NULL
)
GO

-- Create a supporting new Non-Clustered Index.
CREATE UNIQUE NONCLUSTERED INDEX idx_Test ON Customers(Value)
GO

-- Insert 80000 records
DECLARE @i INT = 1
WHILE (@i <= 80000)
BEGIN
	INSERT INTO Customers VALUES
	(
		@i,
		CAST(@i AS CHAR(10)),
		CAST(@i AS CHAR(10)),
		CAST(@i AS CHAR(5)),
		@i
	)

	SET @i += 1
END
GO
To access the table data, I also create a simple Stored Procedure that accepts an input parameter value and uses that as a filter predicate.
-- Create a simple stored procedure to retrieve the data
CREATE PROCEDURE RetrieveCustomers
(
	@Value INT
)
AS
BEGIN
	SELECT * FROM Customers
	WHERE Value < @Value
END
GO
And now I execute the stored procedure with the input parameter value of 80000.
-- Execute the stored procedure.
-- This generates an execution plan with a Key Lookup (Clustered).
EXEC RetrieveCustomers 80000
GO
When you now look at the actual execution plan, you can see that the Query Optimizer has chosen to use a Clustered Index Scan operator that produces 419 logical reads. SQL Server doesn’t use the Non-Clustered Index because it doesn’t make sense because of the Tipping Point. The query result is not selective enough.

And now imagine something happens in SQL Server (like a restart, a cluster failover), and SQL Server discards the cached execution plan. I simulate here a SQL Server restart by just evicting every cached plan from the plan cache through a DBCC FREEPROCCACHE (don’t do that in production!)
-- Get rid of the cached execution plan...
DBCC FREEPROCCACHE
GO
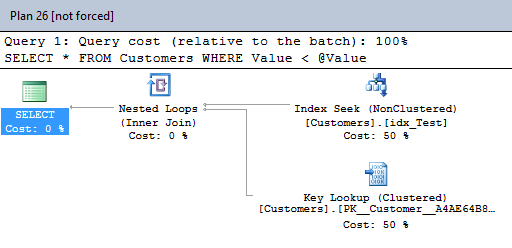
Someone calls now your stored procedure again, but this time with an input parameter value of 1. This time the execution plan is different, because now you have a Bookmark Lookup in it. SQL Server estimates 1 row, and doesn’t find any rows in the Non-Clustered Index. Therefore a Non-Clustered Index Seek in combination with a Bookmark Lookup makes sense, because the query is very selective.

And now I execute the original query again with the input parameter value of 80000.
-- Execute the stored procedure
EXEC RetrieveCustomers 1
GO

-- Execute the stored procedure again
-- This introduces now a plan regression, because now we get a Clustered Index Scan
-- instead of the Key Lookup (Clustered).
EXEC RetrieveCustomers 80000
GO
When you look at the output of STATISTICS IO, you can see that this query produces now 160139 logical reads – previously the query produced only 419 logical reads. That’s when my red phone rings, and I try to help my customer with the performance problem. But today you are going to do things differently - you will use the Query Store functionality that you enabled earlier for your database.
When you look at the actual execution plan, you can already see that you have a plan regression in front of you, because SQL Server has just reused the cached plan with the Bookmark Lookup. Previously you had an execution plan with a Clustered Index Scan operator. That’s a side-effect of the parameter sniffing problem in SQL Server.

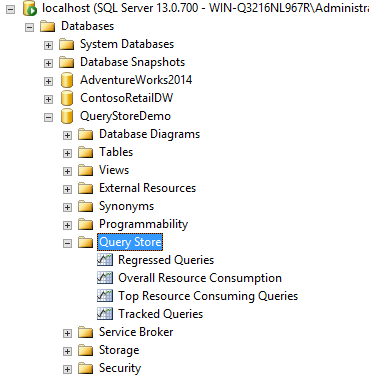
Let’s try to understand this problem in more detail through the Query Store. When you go to Object Explorer, SQL Server 2016 provides you a new node called Query Store, where you will find some reports.

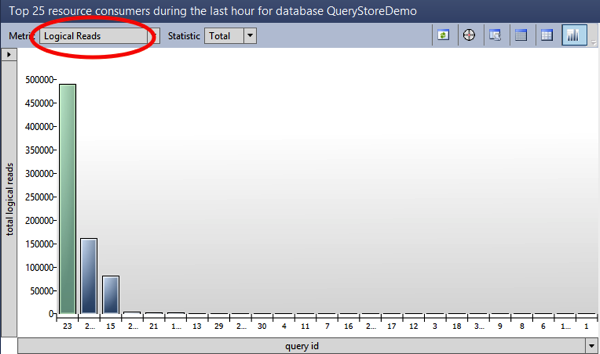
The report Top Resource Consuming Queries shows you your most expensive queries, based on your chosen metric. I have switched here to Logical Reads.

You have here some queries in front of you. The most expensive query produced almost 500000 logical reads – this was our initial INSERT statement. That’s already the first WOW effect about the Query Store: data in the Query Store is persisted across SQL Server restarts! The second bar in the diagram is your SELECT query from the stored procedure. Every captured query in the Query Store is identified with an ID – in our case this query has an ID of 25. And when you now finally look on the right side of the report, you can see the various execution plans of this query.

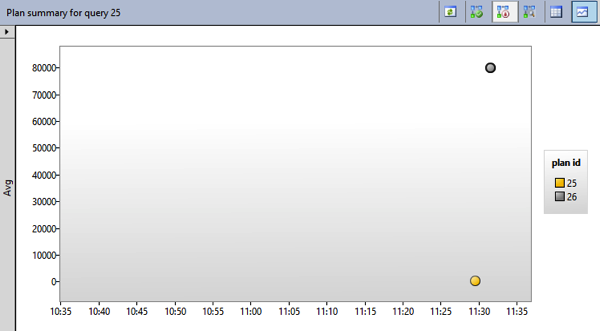
As you can see, the Query Store has captured 2 different execution plans: one with the ID 25, and another one with the ID 26. When you click on the plan ID, SQL Server also shows you the estimated execution plan on the lower part of the report.

Plan ID 25 is the Clustered Index Scan, and plan ID 26 is the Bookmark Lookup. As you can see it is now very easy to analyze a plan regression with the Query Store. But you are not finished by now. You can force now a specific execution plan for a specific query. You know now that your query performs better with the execution plan that contains a Clustered Index Scan. Therefore you can force now query 26 to use the execution plan 26 by clicking on the button Force Plan.

Houston, we have solved our problem!
When you now execute the stored procedure again (with the input parameter value 80000), you will get the Clustered Index Scan in the execution plan, and the stored procedure only produces 419 logical reads – easy, isn’t it? NOOOOOOOOOOOOO!!!!!
Microsoft tells us that this is the *NEW WAY* to fix performance related SQL Server problems. You just force a specific plan, and everything is fine. I have a huge problem with this approach, because the *ROOT CAUSE* of the performance problem is *NOT* solved! The root cause in this specific example was the fact that we had no plan stability because of the Bookmark Lookup. Depending on the input parameter value you get a different initial execution plan that then gets reused – over and over again.
Normally I suggest here to work on your indexing strategy and try to create a Covering Non-Clustered Index to get a Plan Stability. But forcing a specific execution plan just solves the performance problem temporarily – you should still fix the root cause of your problem!
Summary
Don’t get me wrong: the Query Store feature in SQL Server 2016 is awesome and helps you to easily understand plan regressions. And it also helps you to *temporarily* force a specific execution plan. But the goal of performance troubleshooting is still the same: you have to find the root cause, and try to fix the problem – don’t work around it!
Thanks for your time,
-Klaus
4 thoughts on “Performance Troubleshooting with the Query Store in SQL Server 2016”
Oh man – this looks great, but in the wrong hands with a click of a button could be a disaster…
Hello Arun,
Yes, I like such features 😉
-Klaus
I read your article, and I think it should be the problem of parameter sniffing , right?
OK, as the function of sql server is become stronger, do you DBA will be not much more important than today in future ?
Hello Otzi,
Thanks for your comment.
Yes, the underlying root cause was a Parameter Sniffing problem.
-Klaus