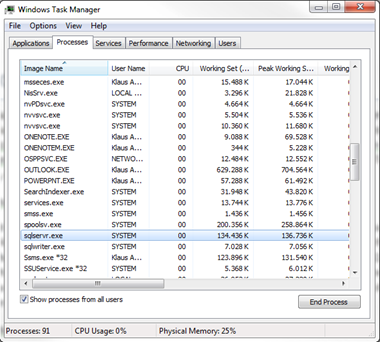
Today I want to talk about a phenomenon regarding memory management in SQL Server. A few weeks ago I had a consulting customer where we made some SQL Server performance improvements. As a side note the customer asked me, why SQL Server isn’t using as much memory as possible on their production system. Their database was about 500 GB, and when we looked into the Task Manager of Windows, we saw that SQL Server was just consuming a few hundred MBs:

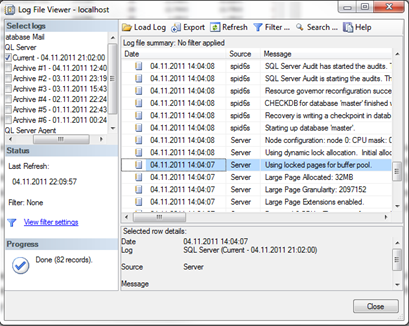
In the first step this behavior of SQL Server was a little bit amazing, but the answer was found very fast, when we looked into the details of their production configuration. The problem was that the customer granted the Locked Pages in Memory privilege to the service account under which SQL Server was running. You can check if you have granted this privilege when you look into the current SQL Server Error Log. If you have granted that privilege, you can see following informational message during the startup of SQL Server:

In the first step of this posting I want to explain why and when you should use that privilege for SQL Server, and in the second step you will see, how SQL Server uses that privilege and why Task Manager is lying to you regarding the memory consumption.
Every time when the Windows OS gets into memory pressure, the Windows OS raises a so-called Memory Resource Notification Event to all processes that are currently running on the box (see http://msdn.microsoft.com/en-us/library/windows/desktop/aa366541(v=vs.85).aspx for the corresponding API function). SQL Server subscribes to this event and processes it internally through a component called the Resource Monitor. Additional information about the Resource Monitor component is reported through the Ring Buffer type RING_BUFFER_RESOURCE_MONITOR that is stored inside the DMV sys.dm_os_ring_buffers. When SQL Server receives the Memory Resource Notification Event, SQL Server must trim its internal caches, like the Buffer Pool, or the Plan Cache to get out of memory pressure. But there are some scenarios in which SQL Server reacts to slow to memory pressure. In that case the Windows OS will do a so-called Hard Working Set Trim, and pages the process (in our case SQL Server) out to the page file. The Windows OS just want to survive and get out of its memory pressure. Imagine that – the Buffer Pool, the Plan Cache – In-Memory buffers – are paged out to the page file! Accessing the Buffer Pool – our in-memory cache – means reading pages from the physical disk! You can imagine that the performance of SQL Server will decrease massively…
Another case when a Hard Working Set Trim can occur is, when you have device drivers that have bugs, or when the Windows OS has bugs that leads to Hard Working Set Trims. Under Windows Server 2003 there were several bugs reported that caused Hard Working Set Trims, like:
- Copying large files from the SQL Server box
- Establishing a Remote Desktop Connection to your SQL Server box
But how you can find out if your performance problems occur because of Hard Working Set Trims? When you are running a version of SQL Server prior to SQL Server 2005 SP2, you have to monitor the overall performance of your SQL Server instance, there are no messages or indications inside SQL Server that can tell you, if a Hard Working Set Trim degraded the performance of SQL Server. Beginning with SQL Server 2005 SP2 Microsoft has added an error message to the SQL Server Log, as soon as a Hard Working Set Trim occurred, like:
” A significant part of sql server process memory has been paged out. This may result in a performance degradation. Duration: 0 seconds. Working set (KB): 1086400, committed (KB): 2160928, memory utilization: 50%”
In such cases you can enable the Locked Pages in Memory privilege to get rid of this issue. In this case the Windows OS is not allowed to page out pages that SQL Server allocated for the Buffer Pool. Yes, you read correct: Locked Pages in Memory is only used for Buffer Pool allocations inside SQL Server!
But on the other hand you also have to investigate WHY a Hard Working Set Trim occurred on your system. A Hard Working Set Trim is just the result of another problem that you have on your Windows box. So you should find the root cause, and eliminate it, instead of using the shortcut (enabling Locked Pages in Memory) infinitely. I know a lot of DBAs who are using Locked Pages in Memory by default, and there are several pro and cons for this which I don’t want to discuss here again. Glen Berry has a great article which describes more of those pros and cons (see http://sqlserverperformance.wordpress.com/2011/02/14/sql-server-and-the-lock-pages-in-memory-right-in-windows-server). One thing that I want to mention here again is the fact that you should limit the memory that SQL Server can allocate for the Buffer Pool when you use Locked Pages in Memory. You can limit the memory through the Max Memory Setting of your SQL Server instance.
By now you know when and how you can enable Locked Pages in Memory for your SQL Server instance. But why the heck Task Manager is reporting a wrong Working Set size when SQL Server is using that privilege. For this explanation we have to dig a little bit deeper into the Win32API. By default (without Locked Pages in Memory) SQL Server allocates memory for the Buffer Pool through the VirtualAlloc function of the Win32API (see http://msdn.microsoft.com/en-us/library/windows/desktop/aa366887(v=vs.85).aspx). But when the SQL Server service account has the Locked Pages in Memory privilege, SQL Server internally uses the AllocateUserPhysicalPages Win32API function (see http://msdn.microsoft.com/en-us/library/windows/desktop/aa366528(v=vs.85).aspx) to do Buffer Pool allocations. This function can be only called by a process, when the process has the SeLockMemoryPrivilege – in other words the Locked Pages in Memory privilege which is the user-friendly name. The Win32API function AllocateUserPhysicalPages is part of the Address Windowing Extensions API (AWE). Therefore those memory allocations can’t be paged out by the Windows OS, because AWE memory regions are not page able by design. Those memory regions are just locked in memory, therefore the name of this privilege. When you have Locked Pages in Memory for your SQL Server service account enabled, it also means that you are using AWE indirectly – funny isn’t it? As you can see from this explanation, Locked Pages in Memory is rather a Windows OS concept than a SQL Server concept. It has nothing to do directly with SQL Server. SQL Server is just a consumer of it.
With this basic knowledge in your hand, it is now very easy to explain why Task Manager doesn’t show the correct Working Set of the SQL Server process: Task Manager is not reporting those memory allocations that are done through the Win32API function AllocateUserPhysicalPages – that’s all about this phenomenon.
But how can you now find out, how much memory SQL Server is really using? There are several possibilities. Inside SQL Server you can use the DMV sys.dm_os_process_memory and the column physical_memory_in_use_kb. This returns you the physical memory that SQL Server is currently using including AWE memory allocations. If you want to have a more detailed breakdown of the memory consumption of SQL Server, you can use the DMV sys.dm_os_memory_clerks. A memory clerk is a component inside SQL Server, which tracks memory allocations for a specific component inside SQL Server. SQL Server gives you a memory clerks for each major component for each available NUMA node in your system. The column awe_allocated_kb shows you the AWE memory allocations in kb that were allocated by SQL Server through the Win32API function AllocateUserPhysicalPages.
Update:
Aaron Bertrand (see http://sqlblog.com/blogs/aaron_bertrand) mentioned that it would also make sense to reference a Performance Monitor counter to track the memory consumption of SQL Server. So here it is:
Outside of SQL Server you can use the Performance Monitor counter SQLServer:Memory Manager/Total Server Memory (KB) to track how large the Buffer Pool currently is.
As you have seen with this posting, memory management inside SQL Server is a really complicated topic, and we just have touched the tip of the iceberg. So don’t trust Task Manager blindly regarding the memory consumption of SQL Server, you really have to know how SQL Server is configured to get the correct picture.
Thanks for reading
-Klaus