A few days ago, one of my customers asked if there is a possibility to get a notification from SQL Server when a query has to wait for a longer time, because an incompatible lock exists on the same object. The answer to this question was easy, because SQL Server provides you for this functionality the so-called Blocked Process Report. Unfortunately this functionality is not enabled by default. Therefore I want to give you a short overview about the Blocked Process Report in this weblog posting, and you can use it to further troubleshoot locking scenarios inside your SQL Server installation.
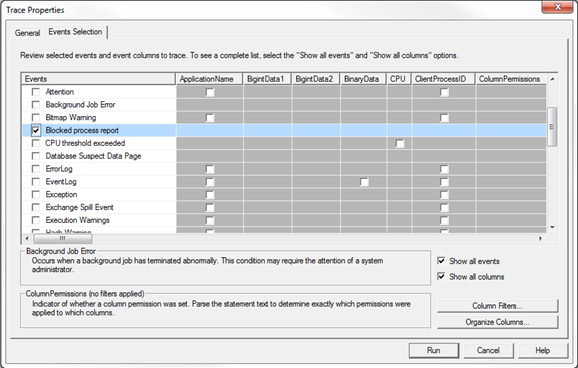
The Blocked Process Report itself is a simple event that you can trace through SQL Server Profiler or SQL Trace. The event is called Blocked Process Report and you can find it within the event group Errors and Warnings:

But that event is only raised, when you enable the Blocked Process Report functionality on the SQL Server instance level through the sp_configure option blocked process threshold. That option just accepts a number between 0 and 86400 and is the number of seconds that a query must wait for a lock until SQL Server raises the Blocked Process Report event. By default that configuration option has a value of 0 which means that this event is never raised. The following code sets the threshold value to 10 seconds:
sp_configure 'blocked process threshold', 10
RECONFIGURE
GO
To demonstrate the Blocked Process Report, I’m just creating a new transaction inside the AdventureWorks2008R2 database through an UPDATE statement:
BEGIN TRANSACTION

UPDATE Person.Person
SET Title = 'Mr'
WHERE BusinessEntityID = 1
After the execution of this statement, the query has now acquired an Exclusive Lock (X) on the record where the column BusinessEntityID is equal to 1. In a second session I’m now trying to read the same record. During the reading SQL Server tries to acquire a Shared Lock (S) which leads to a blocking scenario:
SELECT * FROM Person.Person
WHERE BusinessEntityID = 1
GO
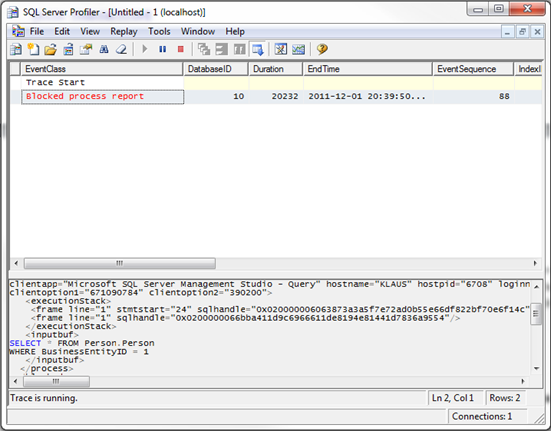
When you have started SQL Server Profiler and when you have configured the Blocked Process Report event, you will see that the event is reported about after 10 seconds:

As you can see from the screenshot, the Blocked Process Report itself is just XML data, so it is very easy to further analyze it, when you are familiar with XML and XQuery.There are 2 important nodes of XML Data – <blocked-process> and <blocking-process>. The first one – <blocked-process> describes the session that was blocked. In our case this was the second session that issued the SELECT statement against the AdventureWorks2008R2 database. The most important thing here is the XML attribute waitresource, which contains the locked resource on which the session was waiting and exceeding the Blocked Process Threshold configuration option.
The second node <blocking-process> describes the session that currently holds the incompatible lock on the resource, on which the other session wants to acquire the lock. The most important part here is the XML element <inputbuf> which shows the SQL statement that acquired the incompatible lock. With that information in your hand it is very easy to further troubleshoot why the Blocking Threshold was exceeded and how you can continue on that (like killing the other session, when it is an orphaned transaction).
The most important thing that you have to remember when you are working with the Blocked Process Report is the fact that SQL Server just generates that XML report, SQL Server WILL NOT resolve the locking/blocking scenario for you! In our case this means that the second session with the SELECT statement will be also running and waiting after SQL Server has raised the Blocked Process Report – SQL Server will never kill here a session – SQL Server just reports that one session has exceeded the Blocked Process Threshold – nothing more.
Thanks for reading
-Klaus